We at TeleData are operating several OpenNebula instances in our datacenters and offer public Cloud services like IaaS, PaaS and scalable Hosting and ISP-Services for our business customers in Germany.
A professional 24/7 monitoring our whole infrastructure is a substantially element for our customers. In this case technical solutions have to offer the ability to drill down the hierarchy to identify bottlenecks and do some crucial capacity management. Every OpenNebula user has to know his workload and has to plan his resources. At TeleData we use a N+1 redundancy to cover host errors and so on.
With this strategy you cannot allocate 100% of your available ressources and you have to monitor your current allocations. Also the possibility to identify your most loaded VMM hosts or your most utilized vDCs could be a valuable information to do system and resource management the right way.
In this little guide we will try to get some monitoring data in form of graphite metrics for further, deeper and last but not least, long-term monitoring.
We think it was quite easy to pull out the information of OpenNebula. Therefore we developed a little script which collects the wanted metrics and sends them to Graphite.
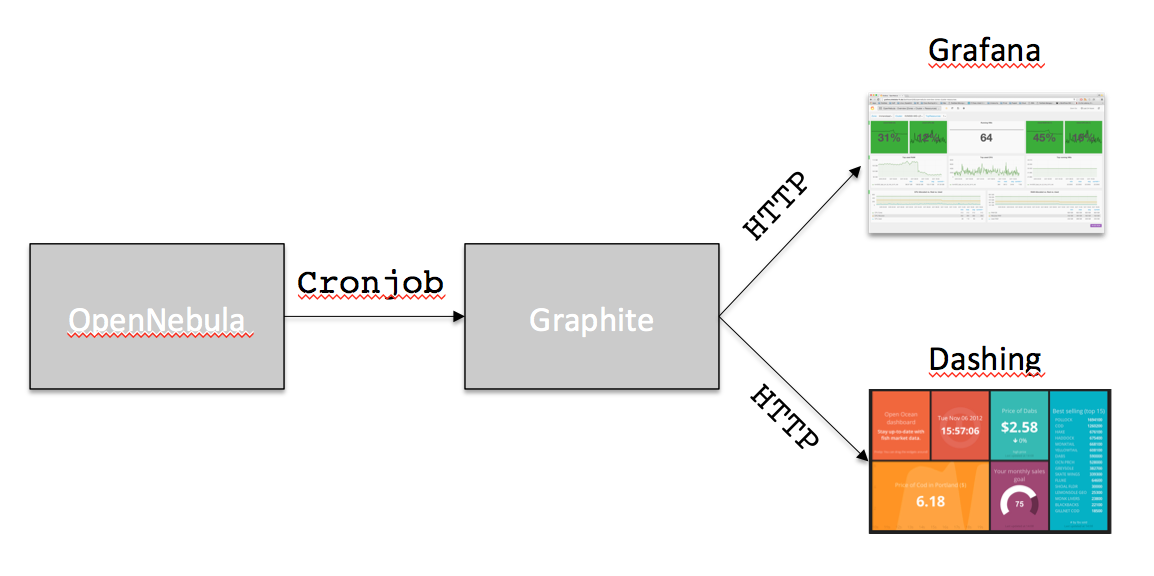
First a small diagram for a quick overview:
Lets start.
(This guide assumes that you are already familiar with Graphite and Grafana)
- Gathering the wanted Information
As advised in the OpenNebula Forum [1] we used the XML-Output of the common tools “onehost” and “onegroup” in the OpenNebula Controller/Daemon, executed by Cronjob every 5 Minutes. The script is Ruby based and uses common Gems like “nokogiri” for XML operations. - Send out metrics to Graphite
The script generates Graphite metrics out of the desired information and pushes them to your Graphite server. Graphite stores the metrics according to your storage schema (the Syntax is Frequency:Retention) - Display / Graph your metrics
With your time series data in Graphite you could use shiny tools like „Grafana“ [2] or „Dashing“ [3] to create informative and quite impressive Dashboards for your OpenNebula OPS Team. With some templating (included in our JSON-Exports) you can unchain the power of Grafana.
See some examples:
All work is published at Github: one-graphite
If there are any questions or issues feel free to add your comment at the OpenNebula Forum [1].
In our opinion OpenNebula works like a charm. It is open and flexible. OpenNebula is one of the most mature, comprehensive and valuable Cloud-Stack available in the market. We mentioned that before: https://opennebula.io/opennebula-at-teledata/
Because of the lack of complexity it`s simple to enhance and to add features.
Of course our Graphite cluster is also powered by OpenNebula, like many other Services.
Have fun!
Links:
[1] https://forum.opennebula.org/t/long-term-statistics-and-capacity-management-for-opennebula-clouds/1886/3
[2] http://grafana.org/
[3] http://shopify.github.io/dashing/


0 Comments