Introduction to the OpenNebula-Prometheus Integration
Today, we delve into the integration between OpenNebula Enterprise Edition and Prometheus. This integration is an exclusive feature for users with the OpenNebula Subscription. It allows for an enhanced level of oversight over your Cloud infrastructure, with comprehensive and detailed metrics for your virtual machines and underlying infrastructure.
Understanding the OpenNebula and Prometheus Integration Process
The core objective of this post is to demonstrate how to effectively set up and utilize OpenNebula and Prometheus together. We will initiate the installation and configuration of the Prometheus integration, followed by a hands-on demonstration on collecting and visualizing data using Grafana. Finally, we will explore the functioning of the alert manager system in-depth.
Exploring the Integration Components
This intricate integration process involves four primary components:
- The OpenNebula exporter, providing basic yet crucial information about the overall OpenNebula cloud.
- The libvert exporter, offering insights about the VM that is operational on an OpenNebula host, essentially reflecting the KVM domains.
- Sample alert rule files, generated based on the metrics furnished by OpenNebula.
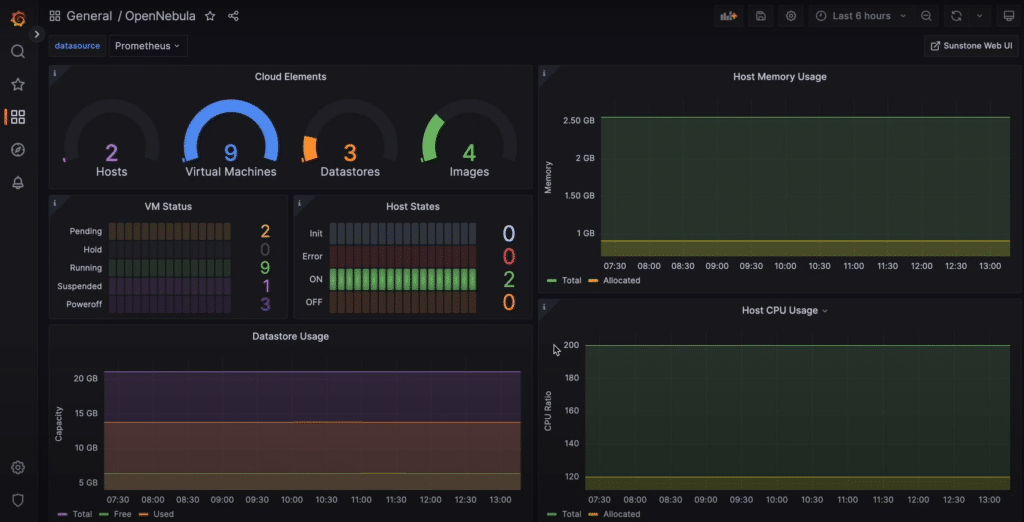
- A Grafana dashboard designed for visualizing VM host and OpenNebula information in a graphical and user-friendly manner.
The installation of these components is very simple. It is only necessary to install the packages indicated in the guide that you can find in the OpenNebula documentation. This guide will also provide you with the necessary details in case you already have a Prometheus installation and want to use it with OpenNebula as well.
Setting up Prometheus and Grafana
Let’s proceed by configuring Prometheus and Grafana. Grafana, an open source dashboard and visualization tool, is paramount in creating interactive and dynamic dashboards. You can easily install it from its official website, where packages are available for various operating systems. Following the installation and service initiation, we will install Grafana and establish a connection with our Prometheus instance.
Grafana Configuration and Dashboard Setup
Once you log into Grafana, Prometheus is added as a new data source. This can be accomplished by navigating to the configuration, selecting “add data source”, and filling out the necessary details for your Prometheus instance. After the successful addition of the Prometheus instance, dashboards are added to visualize the collected data.

You can conveniently find predefined dashboards in your front-end node in the path ‘/usr/share/one/grafana/dashboards/’.
Once done, you can view all the real-time metrics gathered by Prometheus directly on the dashboard, such as the CPU usage, memory usage, and disk usage of the OpenNebula hosts. These files are fully configurable so feel free to adapt them according to your needs.
Customizing the Dashboard and Setting Alerts
In the final stages of this integration, we will set up the Alert Manager. Alerts serve as a reliable method to oversee your Cloud infrastructure and get notified about specific event occurrences. Post-installation, the Alert Manager should be operational in your system. AlertManager is part of the Prometheus distribution and should be already installed in your system after completing the installation process. To configure an alert, you first need to define its trigger condition. This can be done using a combination of operators and thresholds. For example, you can create an alert that triggers when a VM’s CPU usage exceeds 80% for more than 5 minutes.

Alert configuration requires defining trigger conditions by using a suitable combination of operators and thresholds. OpenNebula provides a variety of predefined alerts for a wide range of events like virtual machine creation, deletion, migration, host state alterations, or storage issues. Additionally, custom alerts can be set up based on metrics such as CPU usage or memory consumption. A comprehensive list of available metrics can be found in the documentation.
Wrapping up
In conclusion, the OpenNebula integration with Prometheus provides a powerful combination of cloud infrastructure management and monitoring. With detailed metrics available for virtual machines, hypervisors, and the OpenNebula infrastructure itself, you can quickly identify and resolve any issues in your environment.
Exclusive features and integrations, like this one, are just one of many benefits of having an OpenNebula Subscription and using our Enterprise Edition ⭐ If you have any questions, or would like more information, you can reach out to sales@opennebula.io.


0 Comments